The University of Turin (UniTo) released the open-access dataset UniToBrain collected for the homonymous Use Case 3 in the project. UniToBrain is a dataset of Computed Tomography (CT) perfusion images (CTP). The dataset includes 100 training subjects and 15 testing subjects used in a submitted publication for the training and the testing of a Convolutional Neural Network (CNN). See for details:
- https://arxiv.org/abs/2101.05992,
- https://paperswithcode.com/paper/neural-network-derived-perfusion-maps-a-model,
- https://www.medrxiv.org/content/10.1101/2021.01.13.21249757v1.
At this stage, the UniTo team released this dataset privately, but soon it will be public. This is a subsample of a greater dataset of 258 subjects that will be soon available for download at https://ieee-dataport.org/. CTP data from 258 consecutive patients were retrospectively obtained from the hospital PACS of Città della Salute e della Scienza di Torino (Molinette). CTP acquisition parameters were as follows: Scanner GE, 64 slices, 80 kV, 150 mAs, 44.5 sec duration, 89 volumes (40 mm axial coverage), injection of 40 ml of Iodine contrast agent (300 mg/ml) at 4 ml/s speed.
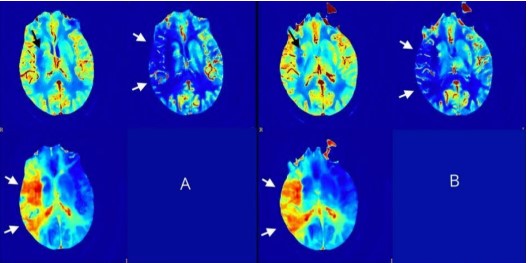
Perfusion maps were calculated, including CBF, CBV, Delay, MTT, TTP, using a standard pipeline of spatial pre-processing and a state-of-the-art fast model-based non-linear regression (NLR) method developed By Bennink et al. [1]. Motion correction was done using a rigid registration method and subsequently all images were filtered implementing a bilateral filter [2,3]. Arterial input function (AIF) calculation was done automatically on a 100 voxels sample. The box-shaped model developed by Bennink et al. describes the impulse response function (IRF) of the perfused tissue in terms of CBV, MTT, and tracer delay. The box-shaped IRF enables fast NLR analysis, which is critical in a clinical setting such as ischemic stroke. For normalization Elastix 4.8 was used with a 3D Euler transform (i.e., rigid, size preserving), 2 resolution levels (8x with 2000 samples, 1x with 8000 samples), and the ‘Advanced Mean Squares’ similarity metric, all linear interpolation.
The software was written in Matlab (user interface) and C (filtering, analysis). Regarding the bilateral
filter, the spatial kernel size was 3 mm (SD) and the range kernel (i.e., intensity) size was 20 HU (SD). The AIF extraction was fully automatic, and part of ‘in-house’ software. The AIF is determined from the aligned CTP by averaging all attenuation curves in an automatically segmented part of the arterial tree. The AIF was rescaled such that its AUC equals that of the automatically segmented VOF (to correct for partial volume effects). Time attenuation curve of the tissue and the relative CBF, CBV, Delay, MTT, TTP maps are estimated using the calculated AIF with the computed IRF. This dataset contains the description of image acquisition parameters in CSV format (data_ctp.csv), the raw images, the realigned images, the filtered images, and the perfusion maps (CBF, CBV, Delay, MTT, TTP) zipped in a single file. Inside the 7z file (ctp_data.7z), subjects are recorded in DICOM format following the data structure (see below). You can find the metadata and data structure in pdf format (UniToBrain DeepHealth Data and Metadata – Metadata.pdf and UniToBrain DeepHealth Data and Metadata – Data structure.pdf).
References
- Bennink E, Oosterbroek J, Kudo K, Viergever MA, Velthuis BK, de Jong HWAM. Fast nonlinear regression method for CT brain perfusion analysis. Journal of Medical Imaging 2016. https://doi.org/10.1117/1.jmi.3.2.026003.
- Klein S, Staring M, Murphy K, Viergever MA, Pluim JPW. Elastix: A toolbox for intensity-based medical image registration. IEEE Transactions on Medical Imaging 2010. https://doi.org/10.1109/TMI.2009.2035616.
- Tomasi C, Manduchi R. Bilateral filtering for gray and color images. Proceedings of the IEEE International Conference on ComputerVision, 1998. https://doi.org/10.1109/iccv.1998.710815.